

Installing the monitoring agent
Overview
The CloudPe monitoring agent is a lightweight service that runs inside your virtual machine and streams system metrics — CPU, memory, disk and network — to the regional metrics collector for your VM's region. Once the agent is registered and reporting, the VM's Metrics tab renders live charts, the Alerts tab shows rule state for that VM, and the VM appears in Fleet Health on the Monitoring page.
Enrollment uses a one-time registration token. You generate the token from the CloudPe console (or the API), run the install command on the VM, and the agent exchanges the token for long-lived credentials plus the collector endpoint it should stream to. Nothing needs to be opened inbound on the VM — the agent dials out to the collector over TLS.
Monitoring is a beta feature. GPU metrics are collected additionally on VMs where the NVIDIA driver exposes them.
Before you start
- Beta feature: monitoring appears in the sidebar under Monitoring with a beta pill. Features in beta can change without notice.
- Project and VM: the VM must already exist and be fully provisioned in a region. See Creating and managing virtual machines.
- Permissions: generating a registration token or revoking an agent requires
vms:update. Reading agent status and metrics requiresvms:read. - Region support: the VM's region must have a metrics collector endpoint configured. If it does not, the install command is generated without a collector target and metrics responses report that monitoring is unavailable for the region — contact support in that case.
- Shell access on the VM: root (or
sudo) on Linux, or an elevated PowerShell session on Windows Server. - Supported operating systems: Ubuntu, Debian, AlmaLinux and Rocky Linux on Linux; Windows Server x64. Outbound TLS from the VM to the regional collector must be permitted by your firewall or security group.
Steps
1. Open the VM and generate the install command
- In the sidebar, go to Instances and open the VM you want to monitor.
- Scroll to Agent Installation and click Generate Install Command.
The console mints a one-time registration token and builds the command with the token and your region's collector endpoint already filled in. The plaintext token is shown once and cannot be retrieved again — clicking Generate Install Command a second time rotates the pending token, so only the most recently displayed command works.

2. Run the command on the VM
On Linux, connect over SSH and run the displayed command as root:
curl -sSL https://repo.cloudpe.dev/install.sh | sudo bash -s -- \
  --token <REGISTRATION_TOKEN> \
  --collector <COLLECTOR_ENDPOINT>
The installer detects the distribution, adds the signed CloudPe APT or RPM repository, installs the cloudpe-agent package, writes the agent configuration and registration token, and enables the cloudpe-vm-agent service.
On Windows Server, open PowerShell with Run as Administrator and run the Windows variant of the command:
& ([scriptblock]::Create((irm https://repo.cloudpe.dev/windows/install.ps1))) -Token <TOKEN> -Collector <COLLECTOR> -ApiUrl <API_URL>
The Windows installer registers the CloudPe VM Monitoring Agent as the cloudpe-vm-agent service under the virtual account NT SERVICE\cloudpe-vm-agent, installs the binary under %ProgramFiles%\CloudPe\Agent, and keeps runtime data and logs under %ProgramData%\CloudPe. The Windows binary is not Authenticode-signed; if you run third-party EDR, AppLocker or WDAC, allow-list cloudpe-agent.exe and the service before installing.
3. Confirm registration
Back on the VM detail page, the Agent Installation section shows the registration moving from pending to active once the agent has completed its handshake. You can verify the same thing from the VM directly:
systemctl status cloudpe-vm-agent
Get-Service cloudpe-vm-agent
Get-Content "$env:ProgramData\CloudPe\logs\agent.log" -Tail 100
4. Check that metrics are arriving
Open the Metrics tab on the VM. Charts populate after the agent has pushed its first samples. On GPU VMs, GPU utilisation, VRAM and temperature series appear as well once the driver exposes them.
5. Review fleet coverage
Go to Monitoring and open Fleet Health to confirm the VM is listed with a reporting agent alongside the rest of your fleet.
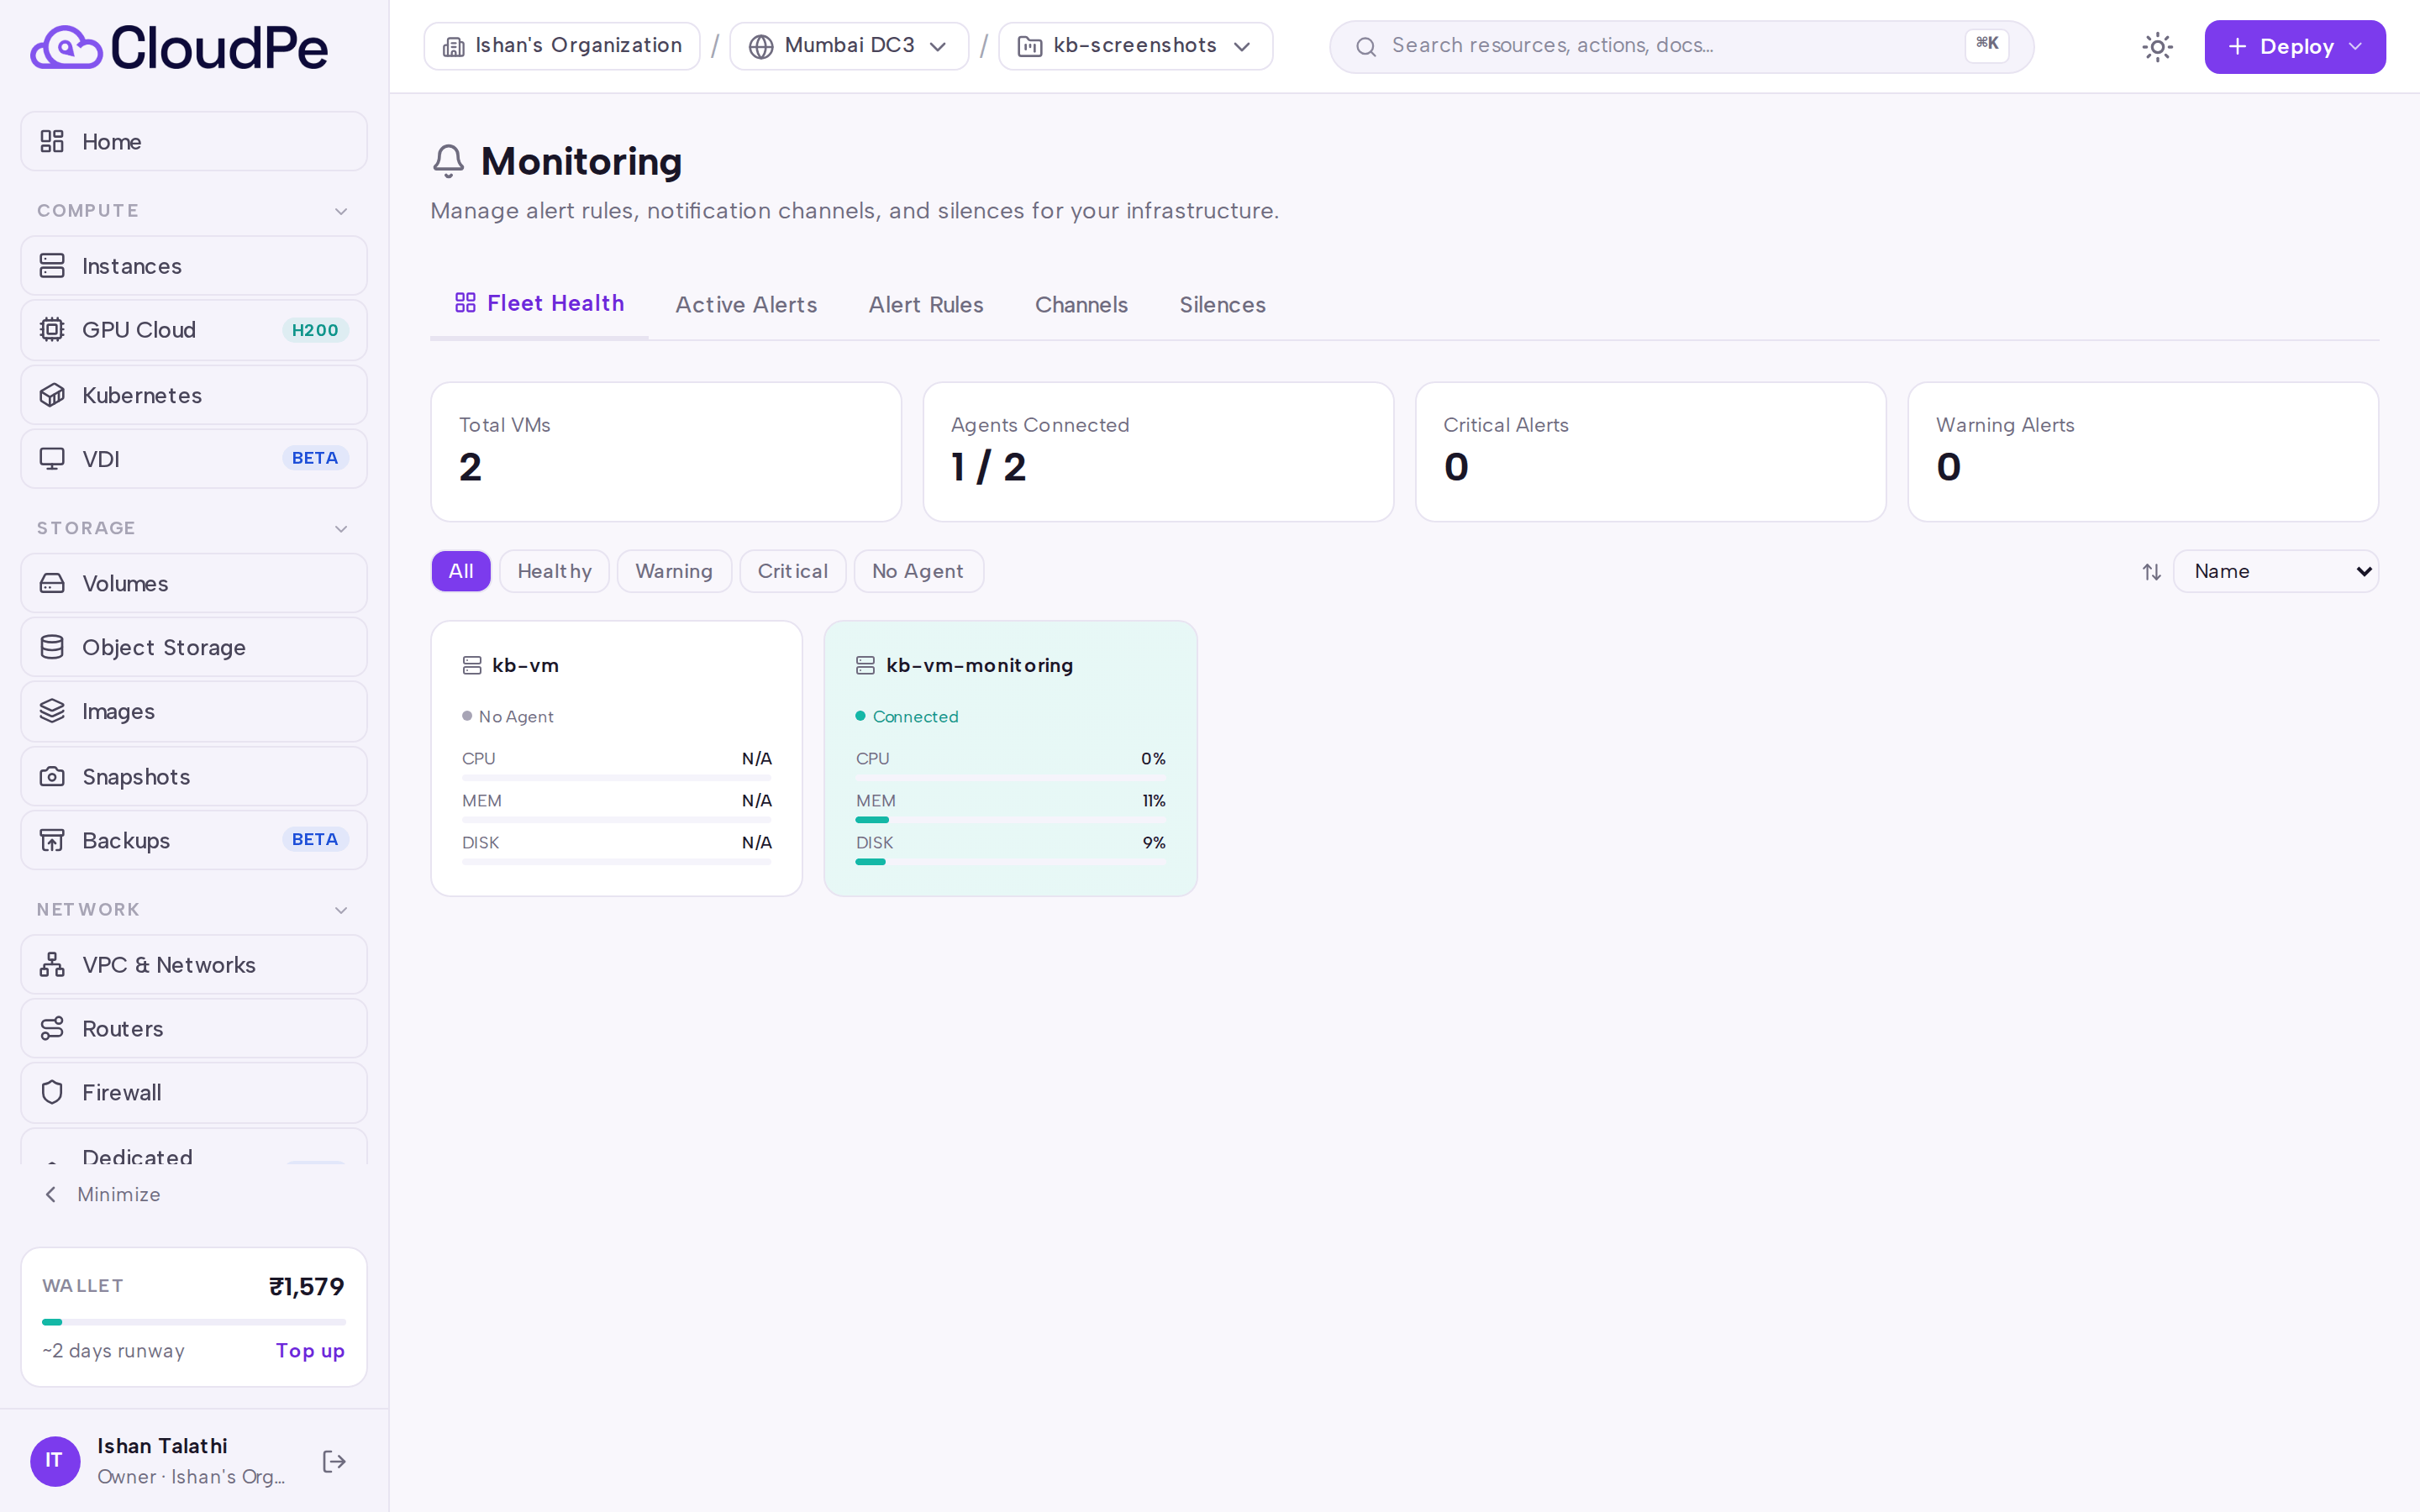
The first agent registration in an organization also seeds a set of default organization-level CPU, memory and disk alert rules. Review and adjust them in Alert rules and notifications.
API
All calls use a bearer API key. Replace <vm_id> with the VM's identifier.
Generate (or rotate) a registration token:
curl -X POST https://app.cloudpe.com/api/v1/vms/<vm_id>/agent/register-token \
  -H "Authorization: Bearer <API_KEY>"
The response carries the plaintext registration token and ready-to-run install commands for Linux and Windows. Run the appropriate one on the VM as an administrator.
Check agent registration status:
curl https://app.cloudpe.com/api/v1/vms/<vm_id>/agent/status \
  -H "Authorization: Bearer <API_KEY>"
Read the agent's own health telemetry (version, uptime, buffered writes, stream errors) and how stale it is:
curl https://app.cloudpe.com/api/v1/vms/<vm_id>/agent/health-metrics \
  -H "Authorization: Bearer <API_KEY>"
Query metrics once the agent is reporting:
curl https://app.cloudpe.com/api/v1/vms/<vm_id>/metrics/latest \
  -H "Authorization: Bearer <API_KEY>"

curl "https://app.cloudpe.com/api/v1/vms/<vm_id>/metrics?period=<period>" \
  -H "Authorization: Bearer <API_KEY>"

curl "https://app.cloudpe.com/api/v1/vms/<vm_id>/metrics/gpu?period=<period>" \
  -H "Authorization: Bearer <API_KEY>"
Every metrics response carries a status discriminator: ok (rows returned), no_data (the query ran and the VM genuinely has nothing for that window), or monitoring_unavailable (the query could not run). When the status is monitoring_unavailable, a reason field distinguishes region_not_configured from query_failed.
Revoke the active agent credential — the agent can no longer refresh and stops streaming:
curl -X DELETE https://app.cloudpe.com/api/v1/vms/<vm_id>/agent \
  -H "Authorization: Bearer <API_KEY>"
Available operations:
| Method | Path |
|---|---|
| POST | /api/v1/vms/{vm_id}/agent/register-token |
| GET | /api/v1/vms/{vm_id}/agent/status |
| GET | /api/v1/vms/{vm_id}/agent/health-metrics |
| GET | /api/v1/vms/{vm_id}/metrics |
| GET | /api/v1/vms/{vm_id}/metrics/latest |
| GET | /api/v1/vms/{vm_id}/metrics/gpu |
| DELETE | /api/v1/vms/{vm_id}/agent |
Limits & billing
- A VM can hold only one active agent credential at a time. Re-enrolling a VM automatically revokes the previous registration, so a rebuilt or re-imaged VM can simply be enrolled again.
- Registration tokens are one-time and short-lived. Generating a new one rotates the pending token in place; the previously displayed command stops working immediately.
- The agent runs inside your VM and consumes that VM's own CPU, memory and disk — no separate billable resource is provisioned for it.
- Metric resolution coarsens as the query window widens: short windows return raw samples, longer windows return downsampled averages. Long-range windows carry no disk-I/O, network-throughput or uptime series, so those charts render as gaps rather than a flat line.
- Registration status values are
pending,active,disconnected,expiredandrevoked. While a VM's agent isdisconnected, other alert notifications for that VM are suppressed so that a dead agent does not produce a storm of unrelated alerts.
Troubleshooting
| Error | Cause | Fix |
|---|---|---|
VM not found |
The VM identifier is wrong, or the VM has been deleted. | Reopen the VM from Instances and generate the install command from its detail page. |
VM not yet provisioned |
The VM record exists but provisioning has not finished. | Wait for the VM to reach a running state, then click Generate Install Command. |
VM not provisioned in cloud infrastructure |
The VM has no backing instance in the region, so no agent can attach to it. | Use Refresh status on the VM detail page; if the state does not resolve, raise a support ticket. |
Project is not provisioned in this region yet |
The project has no footprint in the region you are querying. | Create or move the workload into a region where the project is provisioned, then retry. |
Other common situations:
- Install command fails immediately with a token error: the token was already consumed or was rotated by a later click of Generate Install Command. Generate a fresh command and use only the newest one.
- Agent installs but never reaches active: confirm the VM can reach the regional collector outbound over TLS; a security group or host firewall that blocks egress will let installation succeed while registration and streaming fail.
- The Metrics tab shows "Monitoring temporarily unavailable": the API returned
monitoring_unavailable. If the reason isregion_not_configured, the VM's region has no collector endpoint yet; if it isquery_failed, the regional time-series database could not be reached — retry, and open a ticket if it persists. - The Windows tab of the install card shows a notice instead of a command: the Windows installer needs a collector endpoint (its Collector parameter is mandatory), so CMP does not offer a Windows install command at all while the region is
region_not_configured— offering one would produce a command that fails under the unattended installer and waits for input on a manual run. Contact support to have the region's collector endpoint configured; the Linux command is unaffected and remains available on the Linux tab. - Agent shown as disconnected while the VM is healthy: check the service is running (
systemctl status cloudpe-vm-agentorGet-Service cloudpe-vm-agent) and inspect the agent log, then call the health-metrics endpoint to see how stale the last report is.
FAQ
Can I install the agent automatically when a VM is created? Yes. When you create a VM with agent installation enabled, cloud-init runs the same installer with a token minted at create time, so the VM arrives already enrolled.
Do I need to open any inbound port on the VM? No. The agent makes an outbound TLS connection to the regional collector. Only outbound access is required.
How do I upgrade the agent?
Use the VM's package manager: apt update && apt upgrade cloudpe-agent on Debian and Ubuntu, or dnf update cloudpe-agent on AlmaLinux and Rocky Linux.
How do I remove the agent?
Revoke the credential with DELETE /api/v1/vms/{vm_id}/agent, then remove the package. On Windows, stop and uninstall the service from an elevated PowerShell:
& "$env:ProgramFiles\CloudPe\Agent\cloudpe-agent.exe" --service stop
& "$env:ProgramFiles\CloudPe\Agent\cloudpe-agent.exe" --service uninstall
Which metrics can alert rules use? Alert rules evaluate CPU usage, CPU I/O wait, memory usage and disk usage, plus GPU utilisation, GPU memory usage and GPU temperature on GPU VMs. Disk and network counters are collected for charts but are not available as rule metrics.
Does revoking the agent delete my historical metrics? No. Revoking stops the agent from streaming new samples; already-stored data remains queryable until its retention window elapses.