

Alert rules and notification channels
Overview
Monitoring turns the metrics your VM agents stream into notifications. You define Alert Rules (a metric, an operator, a threshold and a duration), attach one or more notification Channels (email, Slack or a generic webhook), and use Silences to suppress delivery during planned maintenance without losing alert state.
Alert rules are scoped to a single VM, a VM group, a project, or the whole organization. Each rule tracks state per VM through a small state machine — ok → pending (threshold breached, duration not yet met) → alerting (fire notification) → resolved (recovery notification) → ok. A condition that clears before the duration elapses never notifies.
The first time an agent registers for an organization, a set of default organization-level rules is seeded covering CPU, memory and disk at critical and high severities. Seeding happens once — if you delete the defaults, they are not re-created by the next agent.
Monitoring is in beta; behaviour and the console layout may change.
Before you start
- Monitoring is a beta feature. The Monitoring entry sits under the PLATFORM group in the dashboard sidebar.
- At least one VM must have the monitoring agent installed and reporting. Rules evaluate against metrics in the regional time-series store, so a VM with no active agent produces no alerts. See Install the VM monitoring agent.
- Monitoring APIs require the
vms:readpermission on your account. - Decide where notifications should go before you create rules — a rule with no channel attached will change state but deliver nothing.
- Have the destination ready: recipient addresses for an email channel, an incoming webhook URL for Slack, or an HTTPS endpoint (and optional shared secret for HMAC signing) for a webhook channel.
Steps
1. Create a notification channel
- Go to Monitoring in the sidebar and open the Channels tab.
- Click Add Channel.
- Pick the channel type and fill in its configuration:
email— one or more recipient addresses.slack— a Slack incoming webhook URL.webhook— an HTTPS endpoint, plus an optional secret used to sign the payload with HMAC.
- Save the channel, then send a test notification from the channel's row to confirm delivery before you rely on it.
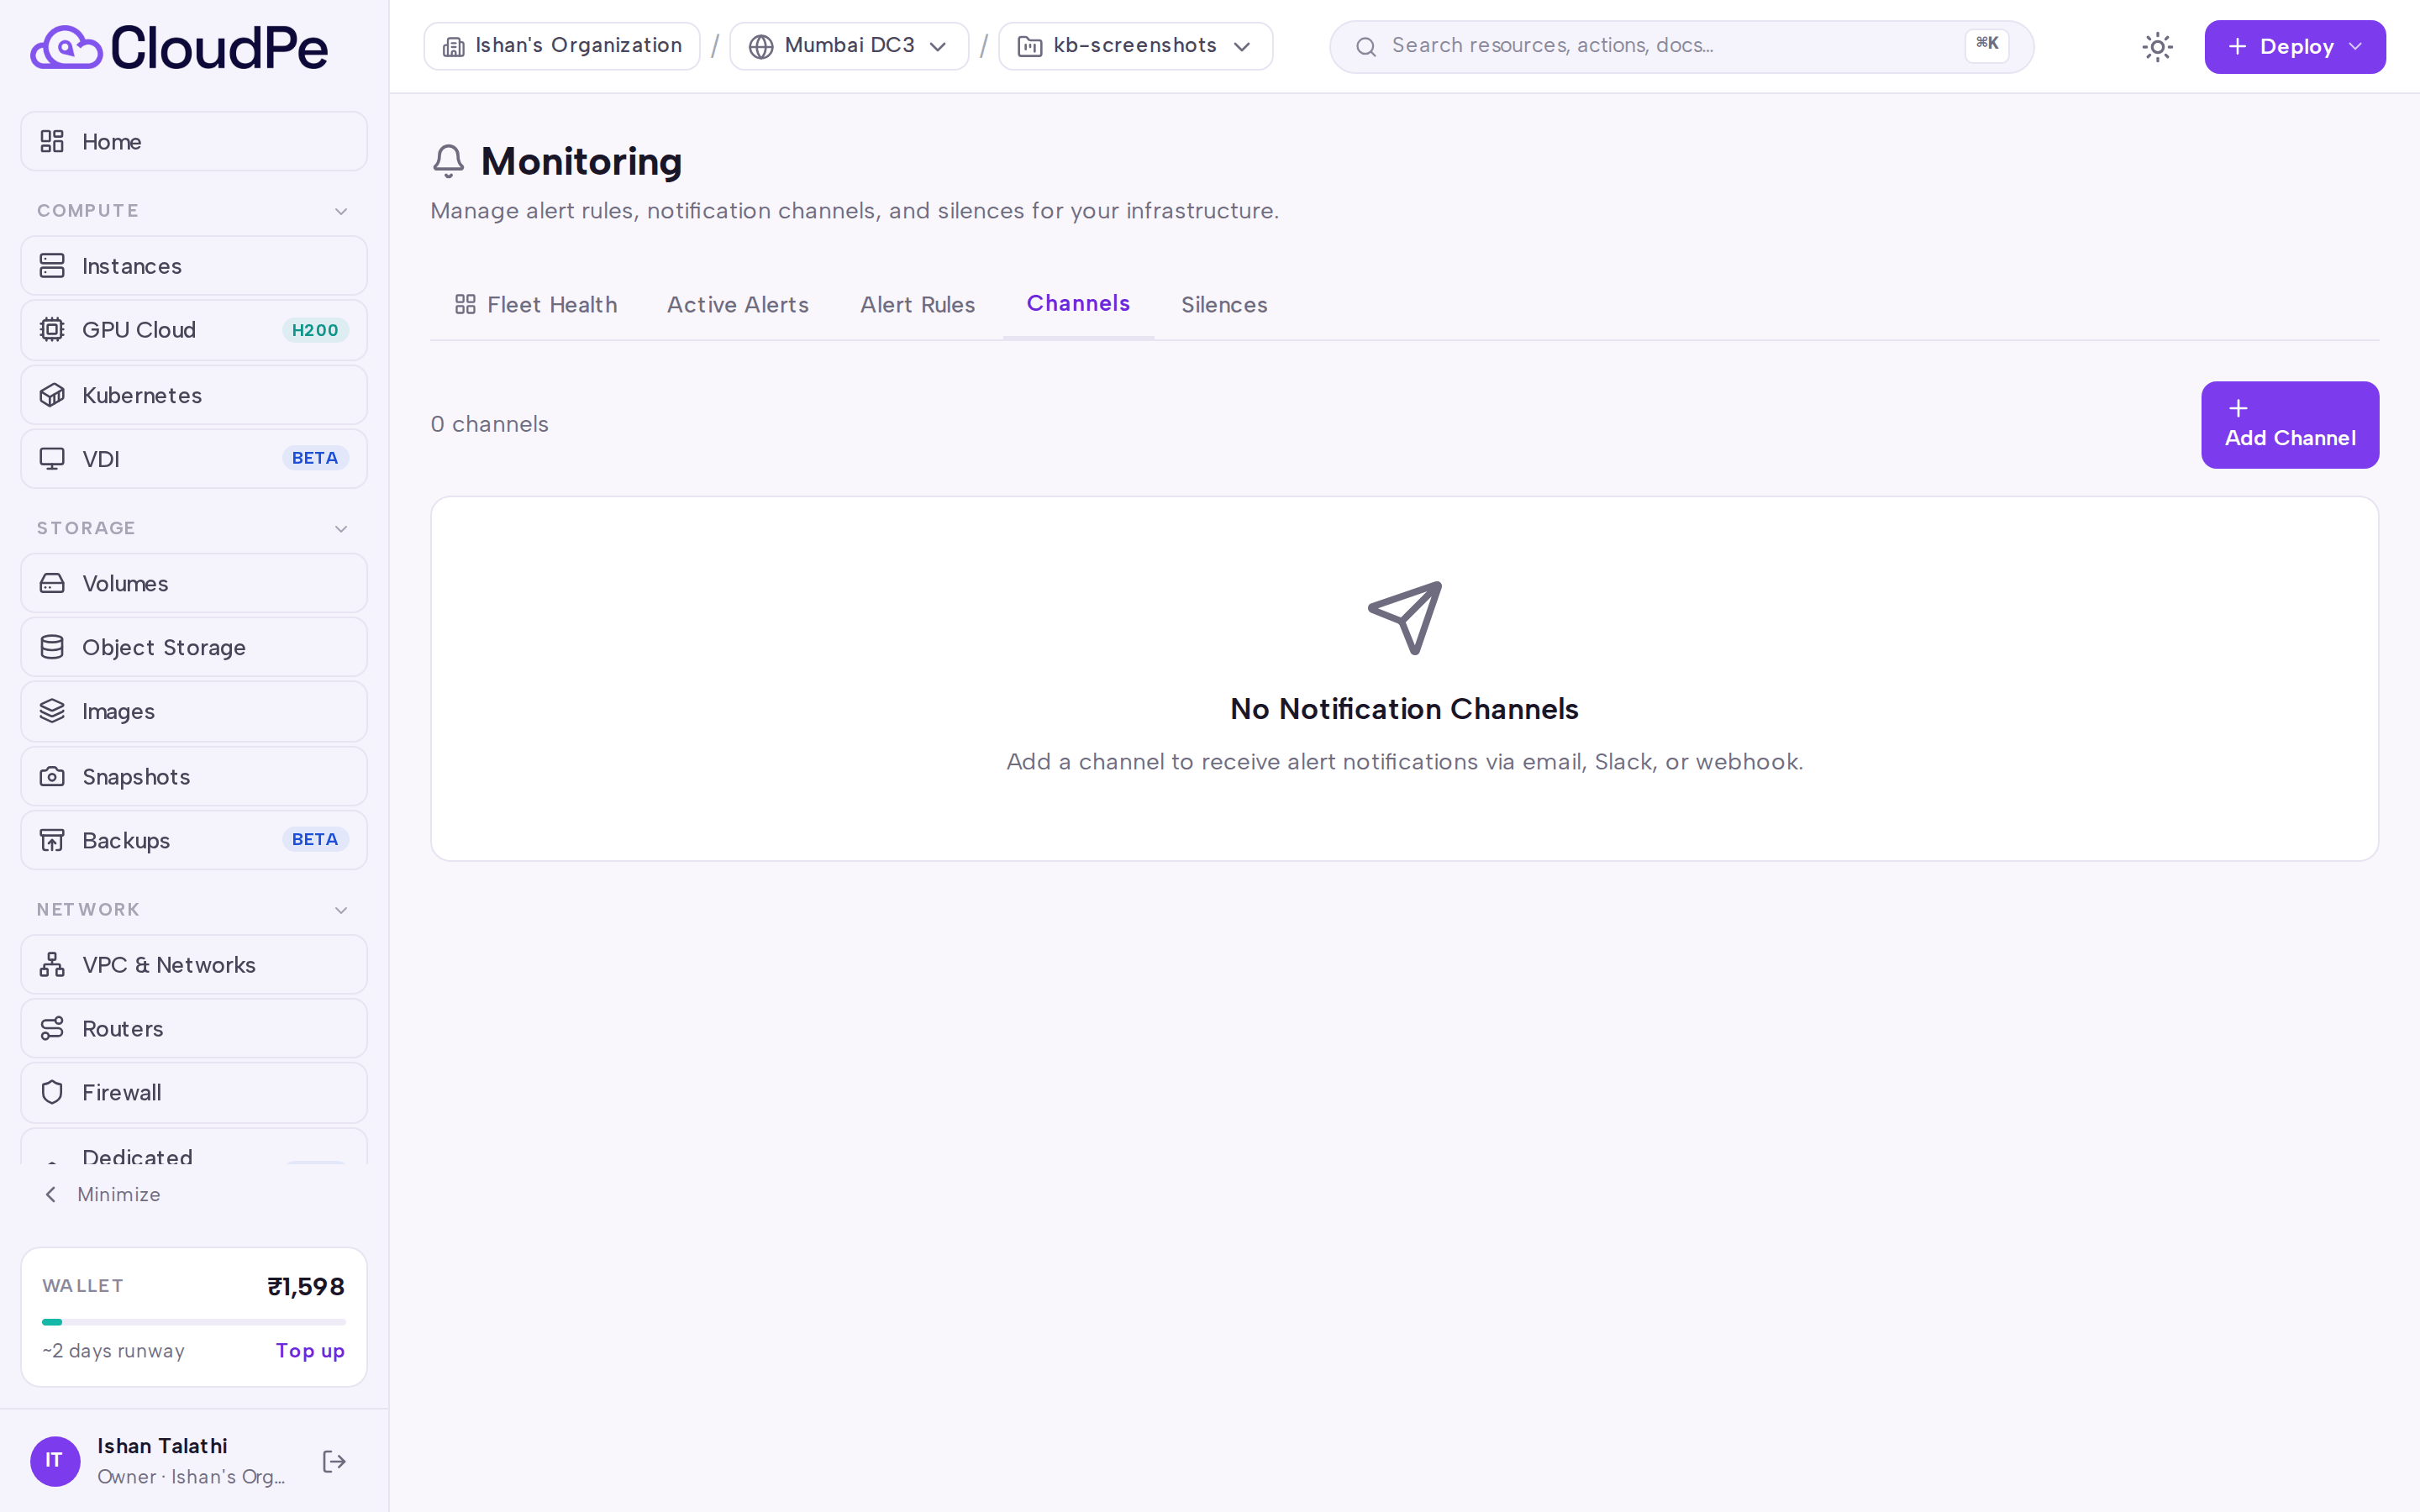
Channels are organization-scoped and shared across all rules in the organization. Deleting a channel is a soft delete.
2. Create an alert rule
- Open the Alert Rules tab and click Create Rule.
- Choose the scope: a single VM, a VM group, a project, or the whole organization. The rule is evaluated separately for every VM the scope resolves to.
- Choose the metric. Alert rules support
cpu_usage_pct,cpu_iowait_pct,mem_usage_pctanddisk_usage_pct. - Choose an operator (
>,>=,<,<=,==) and a threshold value. - Set the duration the condition must hold before the rule fires. Shorter durations react faster; longer durations filter out spikes.
- Set the severity:
critical,warningorinfo. - Attach the channels that should receive the fire and resolve notifications, then save.
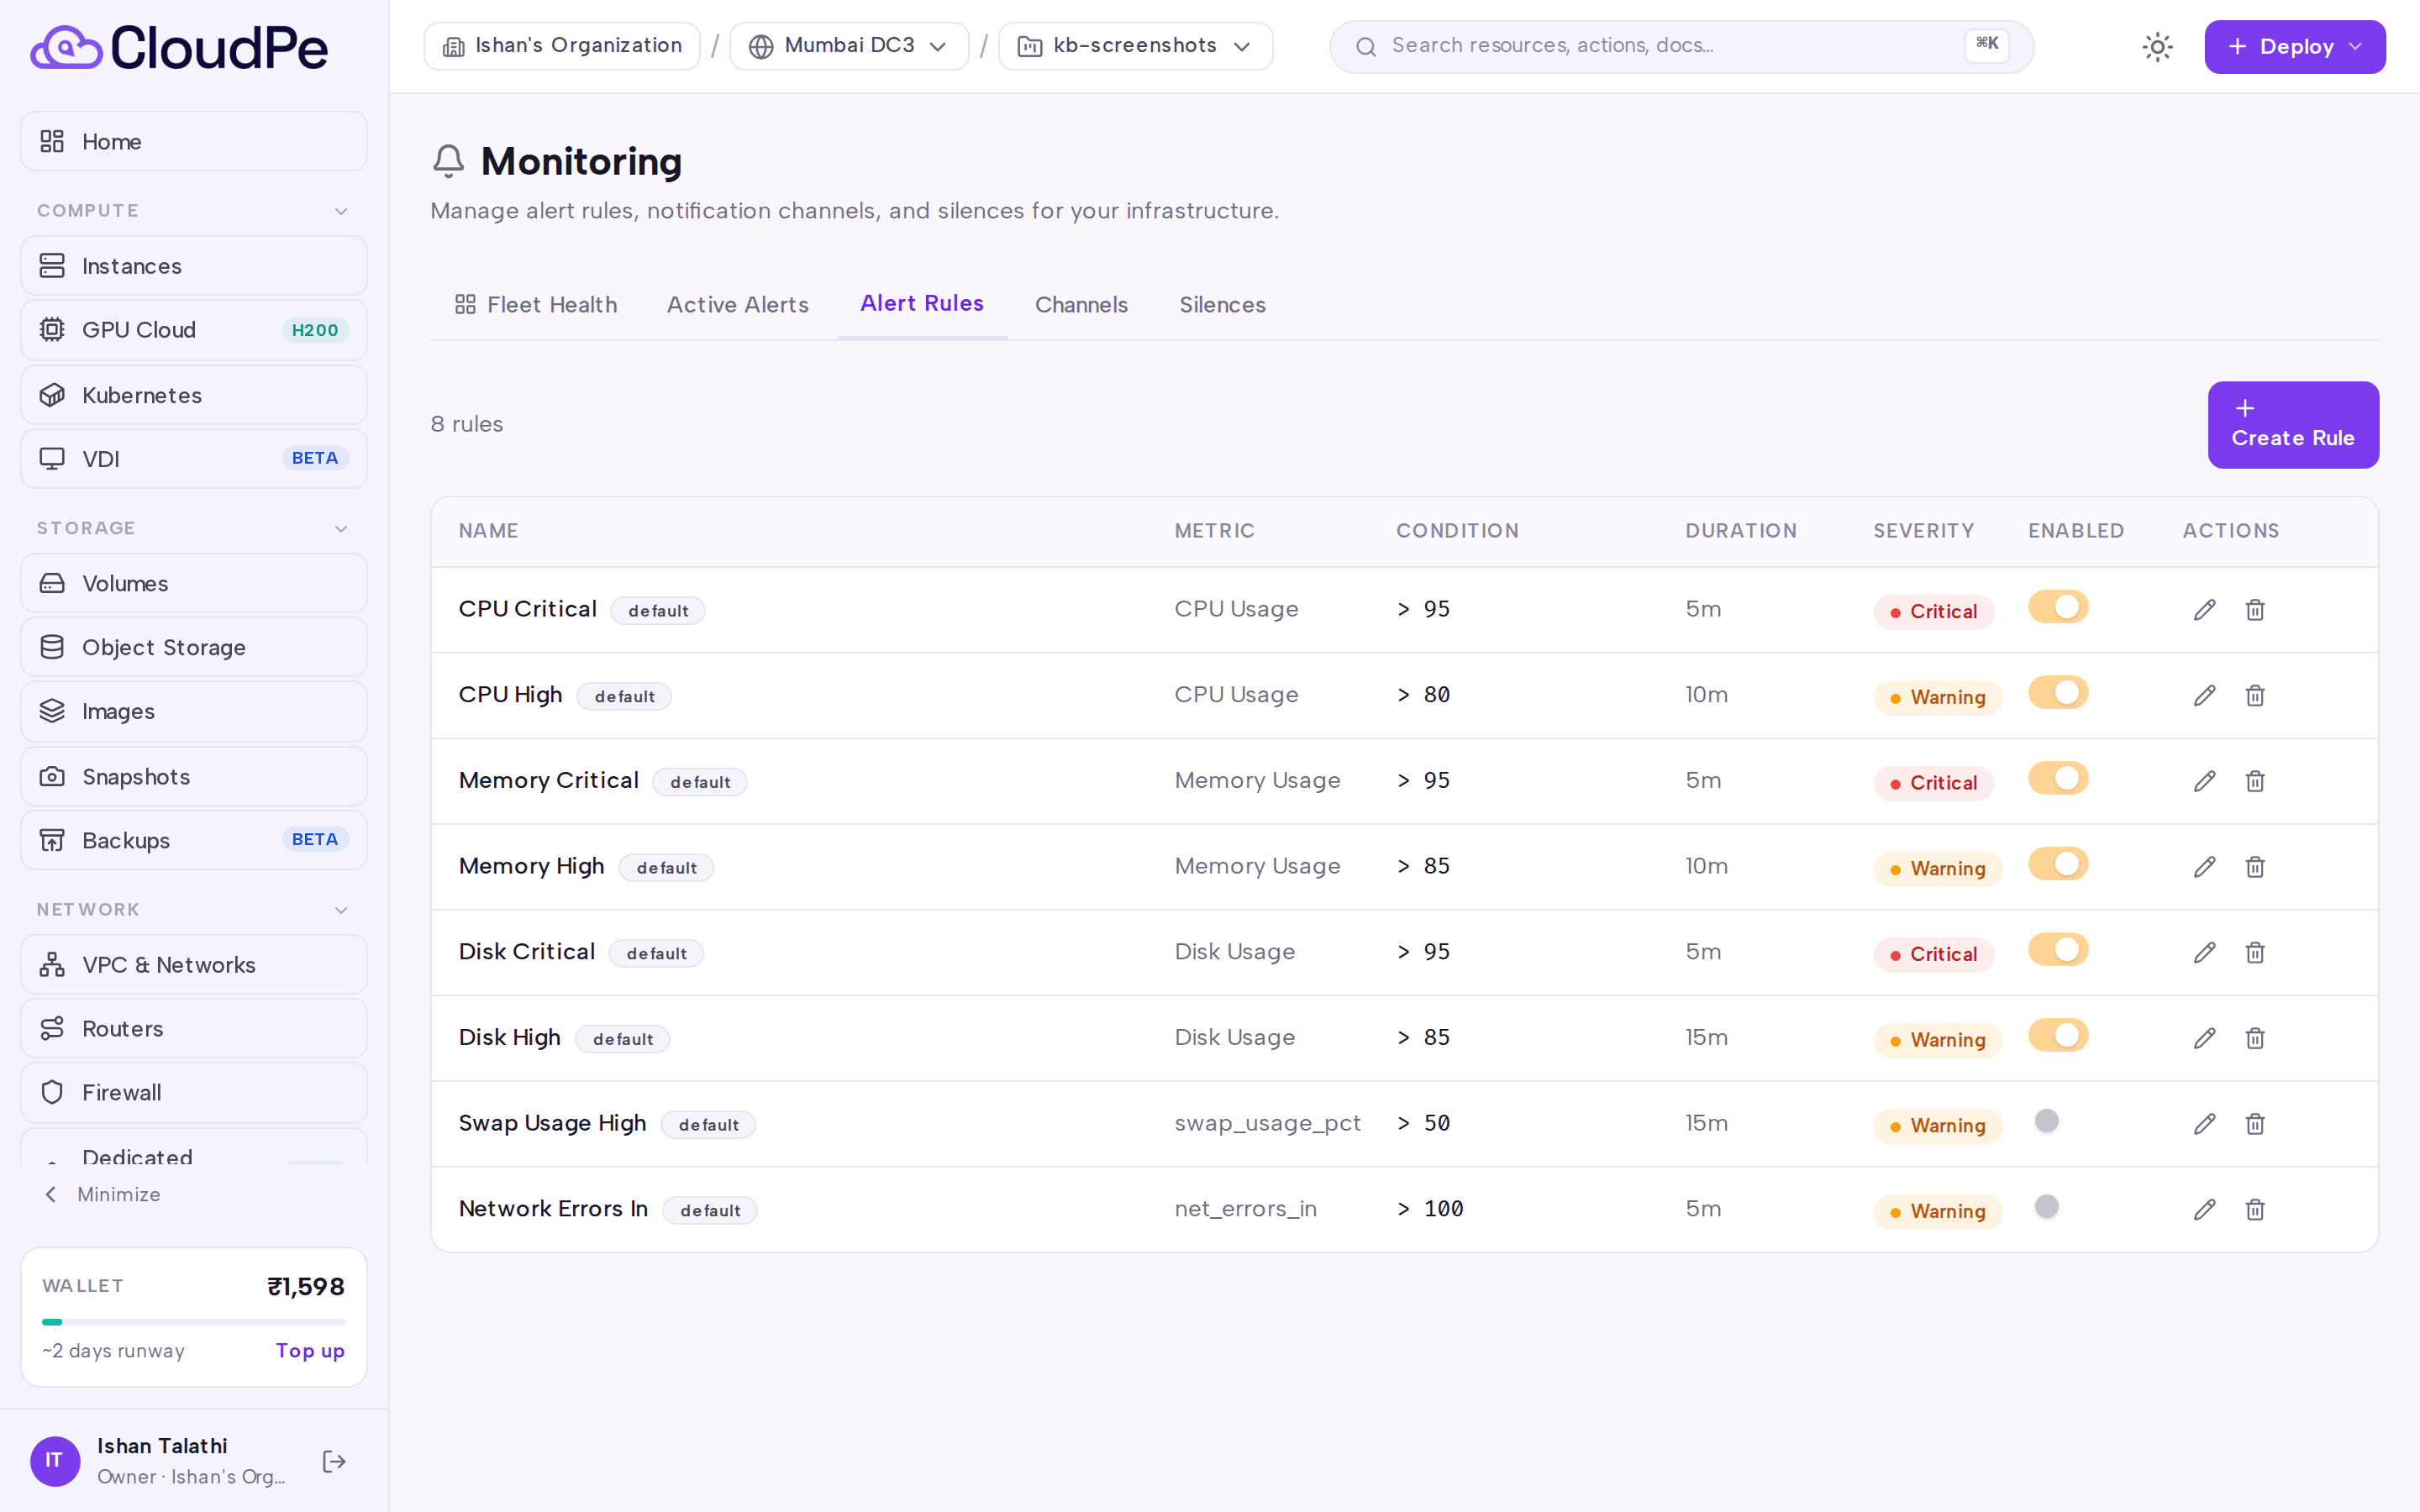
Firing rules appear on the Active Alerts tab while they are in the pending or alerting state; the Fleet Health tab shows agent coverage across your VMs.
3. Silence alerts during maintenance
- Open the Silences tab and click Create Silence.
- Scope the silence to a VM, a project, the organization, or one specific rule.
- Set the start and end of the window and save.
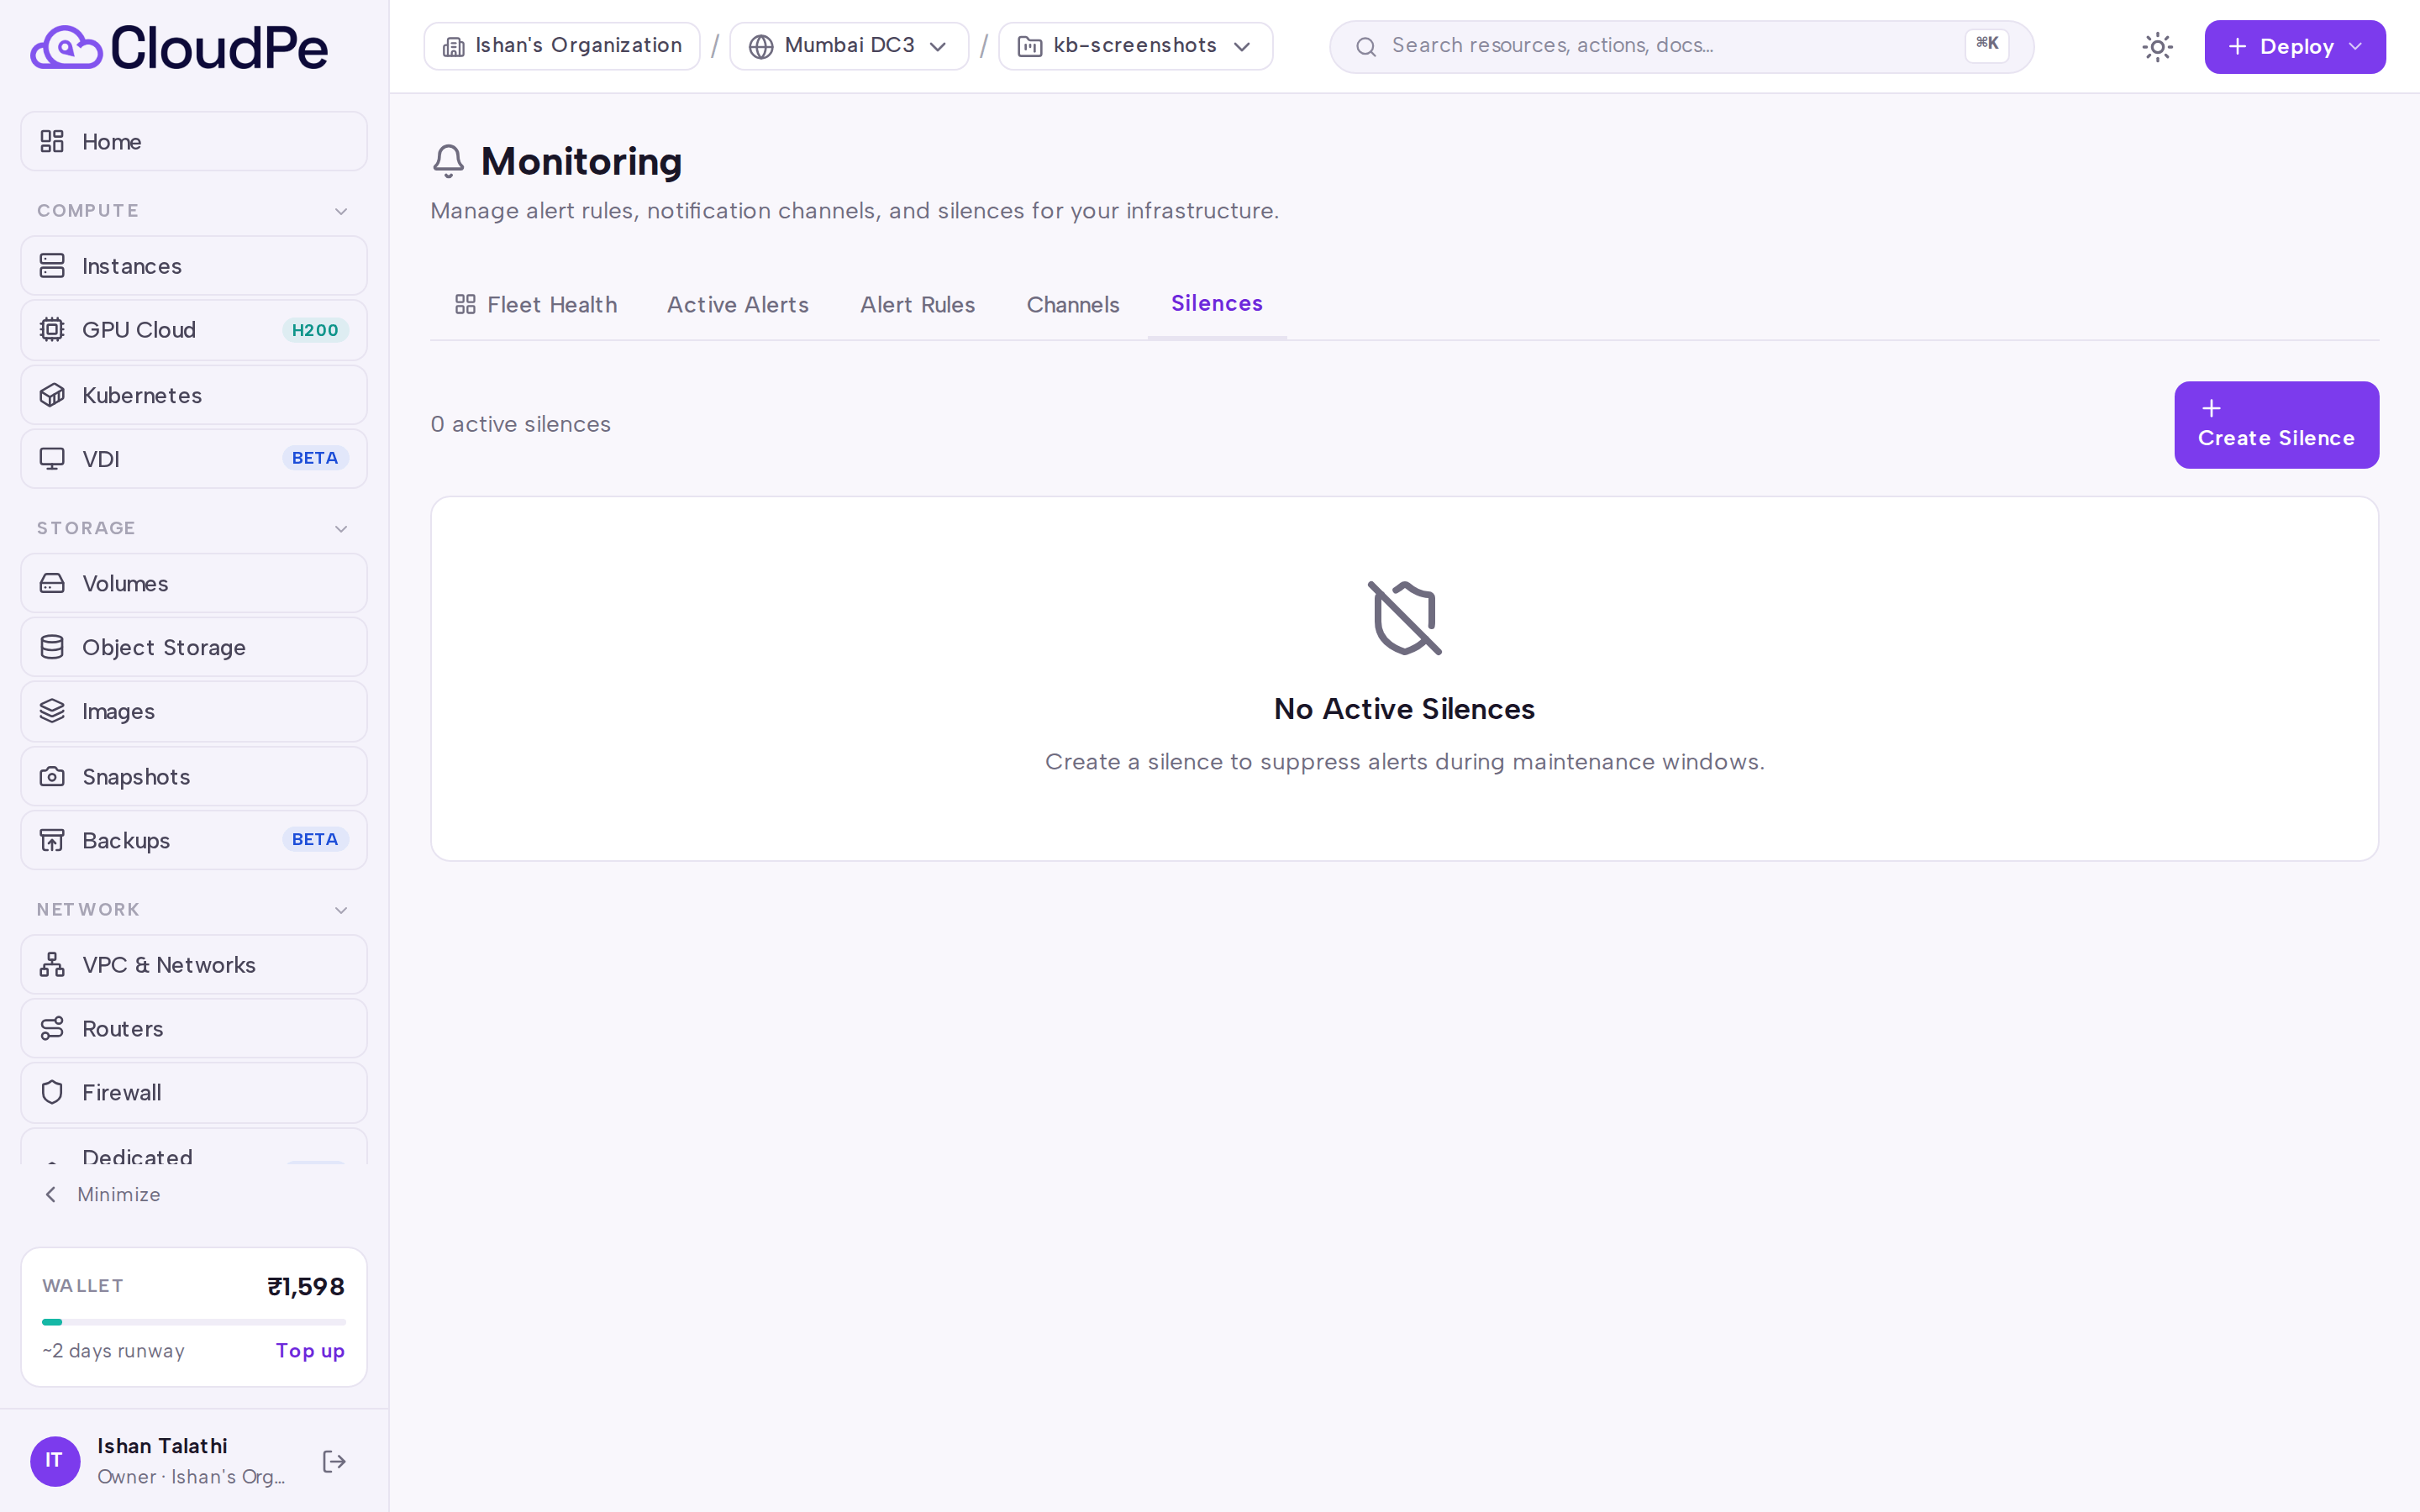
While a silence covers a VM, its project, its organization or the rule itself, notifications are suppressed. Alert state is still evaluated and tracked underneath, so recovery is detected correctly and a still-breaching condition is visible on Active Alerts.
API
Notification channels, alert rules, alerts and silences are available as REST endpoints. All paths are under /api/v1/.
| Method | Path |
|---|---|
GET |
/notification-channels |
POST |
/notification-channels |
PATCH |
/notification-channels/{id} |
DELETE |
/notification-channels/{id} |
POST |
/notification-channels/{id}/test |
GET |
/alert-rules |
POST |
/alert-rules |
GET |
/alert-rules/{id} |
PATCH |
/alert-rules/{id} |
DELETE |
/alert-rules/{id} |
GET |
/alerts |
GET |
/alerts/history?period=24h |
GET |
/alert-silences |
POST |
/alert-silences |
DELETE |
/alert-silences/{id} |
Create an email notification channel:
curl -X POST https://app.cloudpe.com/api/v1/notification-channels \
  -H "Authorization: Bearer <API_KEY>" \
  -H "Content-Type: application/json" \
  -d '{
        "name": "Ops on-call",
        "type": "email",
        "config": { "emails": ["ops@example.com"] }
      }'
Send a test notification to that channel:
curl -X POST https://app.cloudpe.com/api/v1/notification-channels/<id>/test \
  -H "Authorization: Bearer <API_KEY>"
Create an alert rule:
curl -X POST https://app.cloudpe.com/api/v1/alert-rules \
  -H "Authorization: Bearer <API_KEY>" \
  -H "Content-Type: application/json" \
  -d '{
        "metric": "cpu_usage_pct",
        "operator": ">",
        "threshold": 90,
        "duration_seconds": 300,
        "severity": "warning",
        "scope_type": "org"
      }'
List currently active alert instances:
curl https://app.cloudpe.com/api/v1/alerts \
  -H "Authorization: Bearer <API_KEY>"
Note the wire vocabulary if you are scripting against the API: operators are >, >=, <, <=, ==; scopes are vm, vm_group, project, org; the active firing state is alerting; and the list filter for enabled rules is enabled_only.
Limits & billing
- Metric allowlist: only
cpu_usage_pct,cpu_iowait_pct,mem_usage_pctanddisk_usage_pctcan be used in a rule. Disk and network throughput/IOPS counters, load averages and swap usage are not usable as rule metrics — creating a rule with one of them is rejected with HTTP 422, and any pre-existing rules using them were disabled rather than deleted. - Repeat suppression: while a rule instance stays in
alerting, repeat notifications are only re-sent once the rule's repeat interval has elapsed since the last notification. - Inhibition: if a VM's agent is
disconnected, notifications for that VM's other rules are suppressed. State continues to be tracked so recovery still resolves correctly. - Fail-closed evaluation: if the regional metrics store for a rule's scope cannot be queried, no state change is made for that rule in that cycle. An instance already in
alertingis deliberately left alerting rather than cleared on an absence of data. - Alerting, notification channels and silences are part of the monitoring feature and are not billed separately from the resources they watch.
Troubleshooting
- A rule never fires: confirm the VM's agent is active on the Fleet Health tab. A
disconnectedagent both stops producing metrics and inhibits notifications for that VM. - The rule shows as firing but nothing arrives: check that a channel is attached to the rule, and that no silence covers the VM, its project, the organization or that rule. Send a test notification from the Channels tab to isolate a delivery problem from an evaluation problem.
- A rule you created earlier is disabled and will not re-enable: it probably uses a metric outside the supported list. Recreate it with one of the supported metrics.
- Repeated notifications stopped for a still-firing alert: this is expected. Repeats resume only after the rule's repeat interval elapses; the alert remains visible on Active Alerts.
FAQ
Does a silence stop the alert from being evaluated? No. Evaluation and state tracking continue; only notification delivery is suppressed. Recovery is still detected while a silence is active.
Can one rule notify several destinations? Yes. Attach as many channels as you need to a rule; channels are organization-scoped and can be reused across rules.
Why did my alert clear itself without a resolve notification?
A rule that breaches the threshold but recovers before the duration elapses moves from pending back to ok. That transition never notifies.
Do I get the default rules automatically? Default organization-level CPU, memory and disk rules are seeded the first time an agent registers for your organization. If your organization already has any alert rules — including deleted ones — seeding is skipped.
Can I alert on network or disk throughput? Not today. Those counters are not available as rule metrics.